
Universities talk a great deal about breaking down silos, but what does a silo actually look like, and how do you find the people bridging them? Zhouqi Liu, an MFA candidate in Information Design and Data Visualization at Northeastern's College of Arts, Media and Design, spent his research co-op at the Network Science Institute (NetSI), working with Prof. Alina Lungeanu and her lab on developing an interactive visualization tool that reveals intra-university collaboration structures, and that can answer those questions.
The project, “Inside the Institution: Visualizing Institutional Collaboration Networks for Meta-Scientific Exploration”, is a web application that maps the co-authorship relationships of 2,737 Northeastern faculty across 11 colleges, 46 departments, and 64 research centers. It offers three interconnected views — a Collaboration Map, a Research Units View, and a Bridging Scholars View — each using its own visual logic to support a different way of reading the same network. Zhouqi was responsible for every part of it: curating and cleaning the data, designing the interface, prototyping, running a think-aloud study with twenty domain experts, and building the tool itself. The work became the foundation of his 118-page master's thesis, which he defended in April 2026.
According to Zhuoqi, the need the tool addresses is real. Research universities organize their faculty into two kinds of structures: departments built around disciplines, and research centers meant to cross them. Meta-scientists —researchers who study science itself—want to understand whether centers actually change how people collaborate, but the tools available to them are limited. Network software produces static images and University portals let you look up only one person at a time. Neither reveals the overall pattern of collaboration inside an institution, even though that is exactly the scale where universities make consequential decisions about programs, hiring, and investment. "Collaboration networks are usually studied across fields or countries," Zhouqi explains. "The structure of collaboration inside a single institution gets much less attention, and that's exactly the scale where universities make decisions."

What the data revealed was striking. Only 7.1% of Northeastern faculty have a co-authorship tie with someone in a different college, yet the entire network holds together because of that small group. Remove those few hundred bridge scholars, and the connected network breaks apart into isolated, college-specific clusters. Equally surprising was the variation among research centers. Some are organized around a handful of highly connected individuals. Others are densely networked across many small teams. Others are sparse but disciplinarily broad. They all carry the same institutional label, but structurally they are very different things.
Zhouqi came to the project as a designer first. When his co-op advisor mentioned that NetSI was looking for someone for a visualization project, he had no background in network science. What drew him in was the chance to apply what he had been learning to a problem with real stakes and real users. "Instead of designing visualizations disconnected from real needs, I could study how an institution works from the inside and build a tool that researchers would genuinely use."
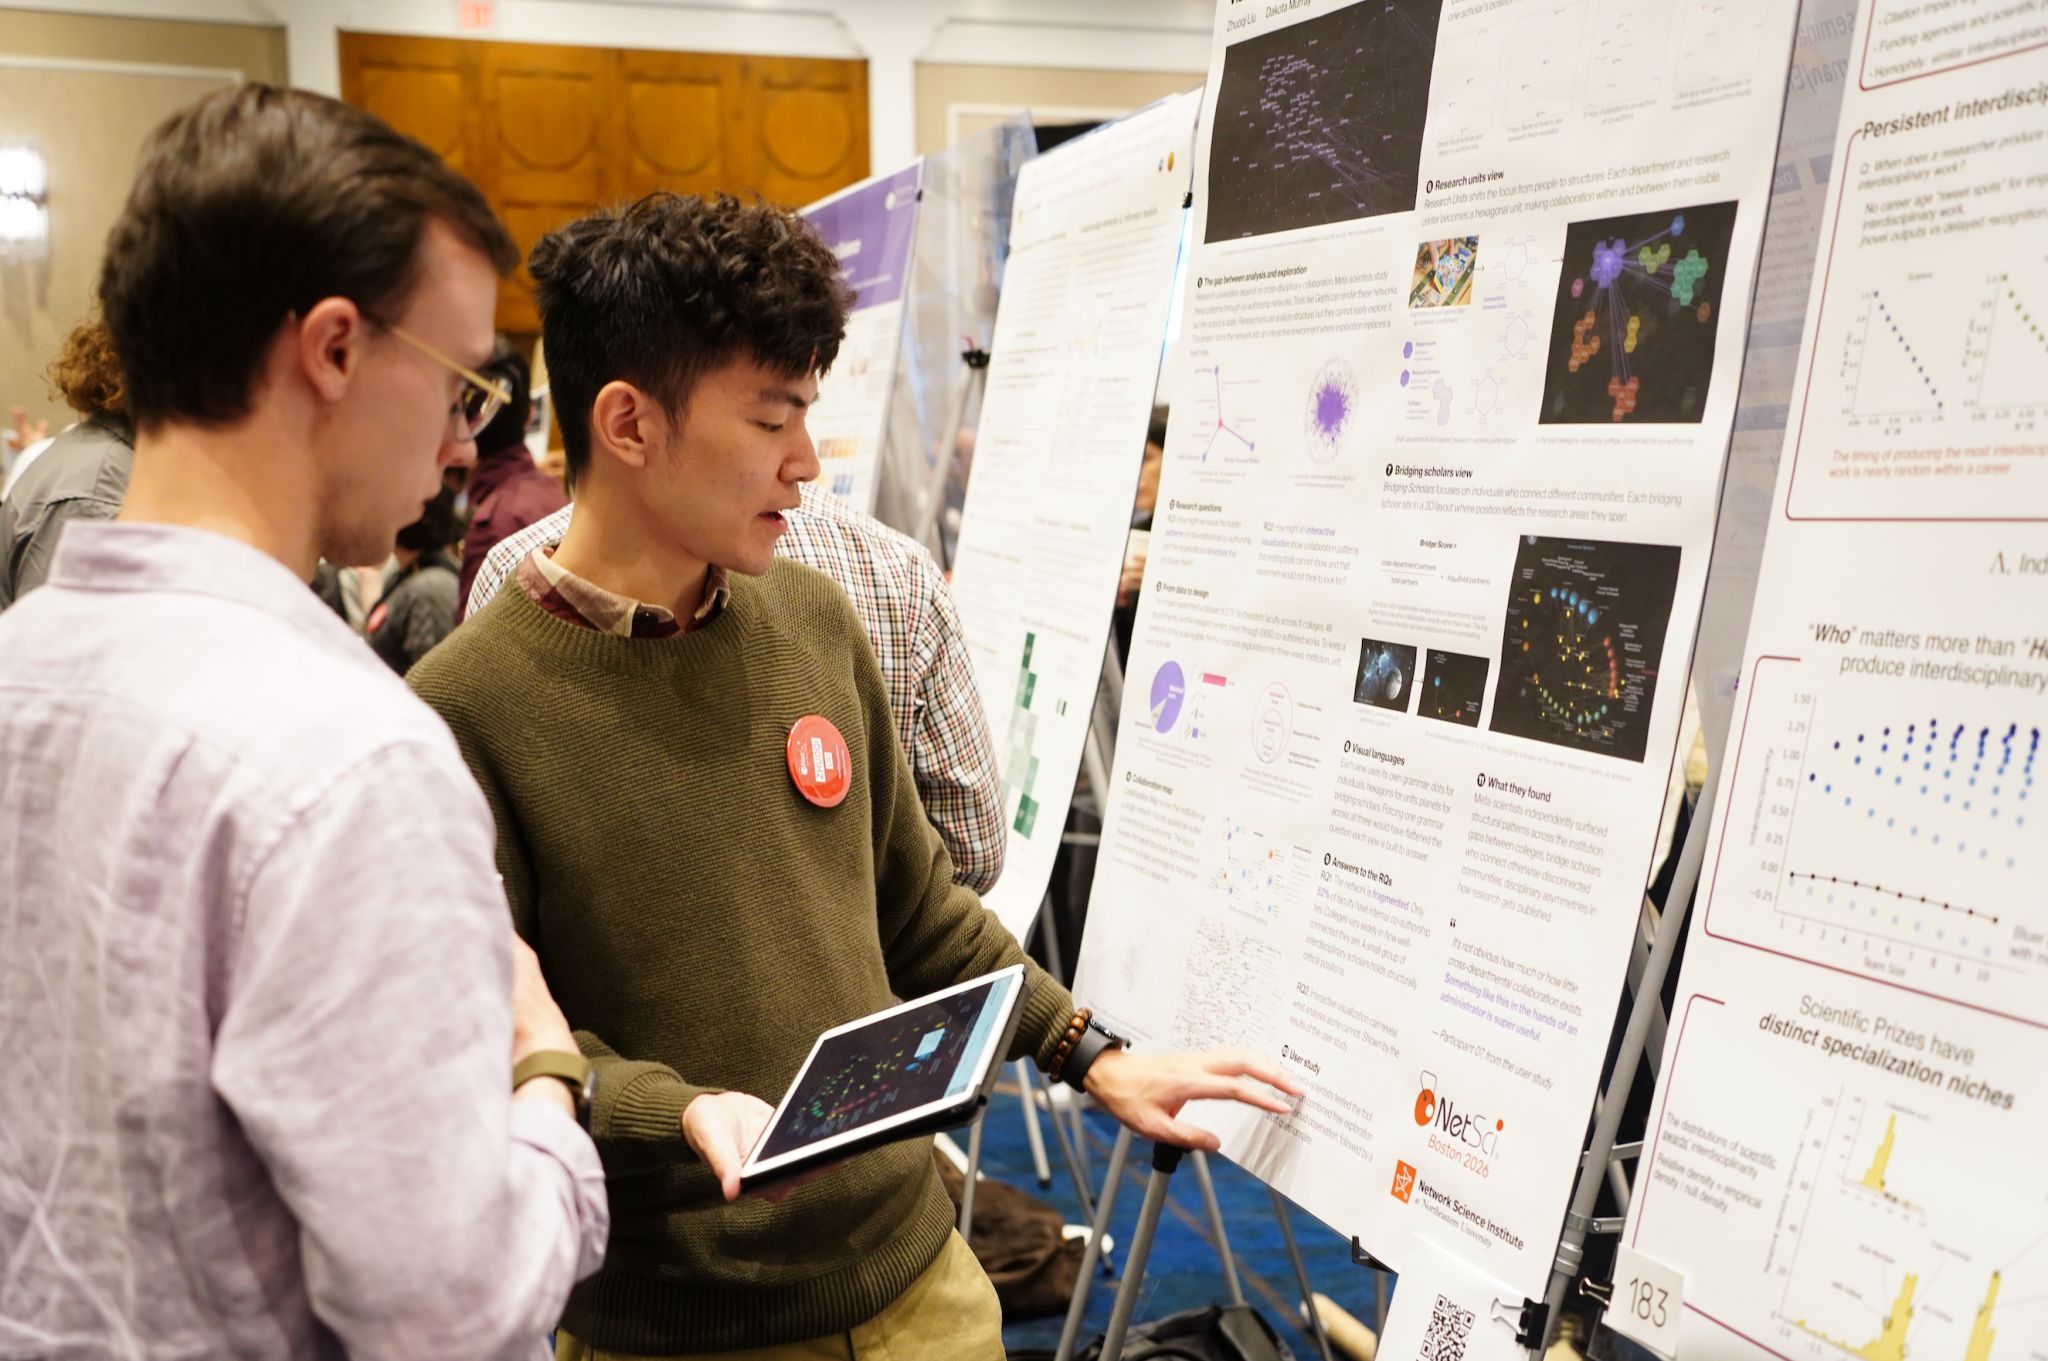
The co-op's most memorable moment came at its close. NetSci 2026, the leading international network science conference, was held in Boston this June, hosted by Northeastern and NetSI. Zhouqi volunteered at what was his first academic conference and presented his work in the poster session. "A lot of people stopped to photograph my poster, asked me for more detail, and told me they were interested in the work," he recalls. He had brought his printed thesis with him, and found the courage to ask some of the researchers whose names he had only ever seen in citations to sign the title page. "People whose names I had only seen in books or heard about in my research were suddenly right there in front of me."
Zhouqi graduates in December 2026. He is looking toward work that combines information design and network visualization, ideally on problems like this one, that begin with a genuine need and end with a tool someone will actually use. For students considering a co-op at NetSI, his advice is direct: come into the office. Talk to people, not just about their work but about everything. "In a way, calling it a co-op at NetSI undersells it," he says. "You're really getting to experience what PhD life is like — and that's incredibly useful when you're planning your own future."
The tool is live and publicly accessible at https://williw7.github.io/neu-network-viz/.
Learn more about the NetSI co-op program at https://www.networkscienceinstitute.org/academics/coop-program
